including condensed consolidated interim financial statements as of September 30, 2019
Key Performance Indicators 1
Group
- Clean CCS Operating Result decreased by 10% to EUR 949 mn
- Clean CCS net income attributable to stockholders amounted to EUR 457 mn, clean CCS Earnings Per Share were EUR 1.40
- High cash flow from operating activities of EUR 1,074 mn
- Organic free cash flow before dividends of EUR 594 mn
- Clean CCS ROACE at 13%
Upstream
- Production rose by 74 kboe/d to 480 kboe/d
- Production cost decreased by 7% to USD 6.3/boe
Downstream
- OMV indicator refining margin stood at USD 5.5/bbl
- Natural gas sales increased by 17% to 27.2 TWh
Key events
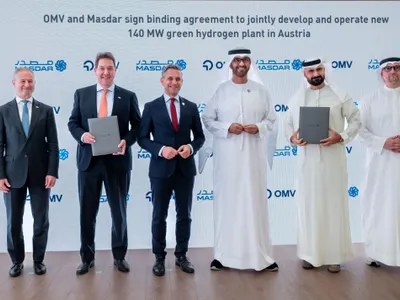
- On July 31, 2019, OMV and ADNOC, the Abu Dhabi National Oil Company, closed the strategic equity partnerships covering both the existing ADNOC Refining business and a new Trading Joint Venture. The shareholder structure for both the ADNOC Refining and the Trading Joint Venture is OMV 15%, Eni 20%, and ADNOC the remaining 65%. The purchase price for OMV amounted to USD 2.43 bn.
1 Figures reflect the Q3/19 period; all comparisons described relate to the same quarter in the previous year except where otherwise mentioned.


